
Data Visualizations
We offer visualization services that will help you gain insights into your large or small complex datasets, providing clarity with analytics. If you have data from different sources you are trying to draw meaning from, our team of developers help you by providing report views your team needs to make operational decisions. We support several business intelligence tools, but our current focus is on Tableau and Looker.
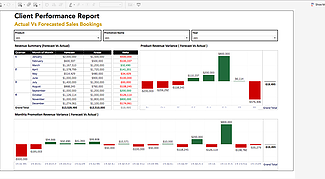
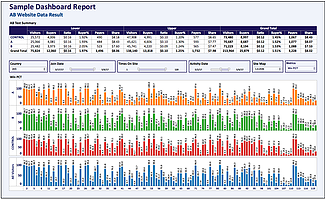
Reporting Visualization: providing insights and comments to create a story that will enable you see through the complications in your data, and cause you to start making easy decisions that will drive value to your business.
Do your questions involve understanding changes in key performance metrics YoY, WoW. Would you like to visualize changes in product performance over a given period? Tableau allows you to do just that
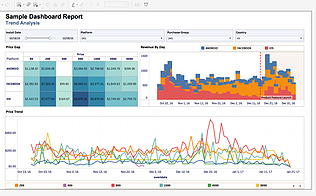
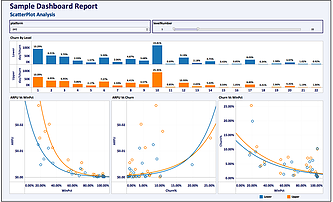
Dashboard Interaction & Patterns: seamless experience making it easy to see your data, work with visualizations and create compelling dashboards. Also, Identify new patterns in reports or dashboards related to highlights in other reports to call out their relationships.
Be it trend lines or heat maps, every organization’s needs are different. It’s our job to understand your data and suggest the best ways to visualize the results.
Automation: Visualizations that involve the use of filters, parameters or actions to show dynamic reports. Gone are the days of rebuilding your reports in excel everyday. With Tableau, you build your reports once, and you can set it to automatically refresh on a daily basis at a time of your choice.
When it comes to slicing and dicing your data with dimensions that give your metrics meaning, Tableau offers filters that allow you to do this easily. More importantly, the parameter feature helps you build IF – Scenarios which allows you to input parameter values to see how the values change your metrics – very helpful in making projections
Data Visualization on Mobile Devices: Designing and deploying data and analysis for easy access on your tablets or smart phones. This is one effective way to keep your data readily available with a streamlined experience.
Apart from being able to have your reports automatically refresh, they are also available to you on the go. Do you have a tablet or a smart phone? Well, you only need to install the Tableau application, and your data would be right on your finger tips for you to continue your data explorations on the go.
“We will pull all your data into one repository, create dashboard
visualizations that will enable you see through the complications in
your data, and help you start making easy decisions that will drive
value to your business.”
Other Services...
Data
Analytics
consulting would mean
that you have experts
eyes looking at youreveryday
challenging problems and...
Game
Analytics
strategies that help our
clients derive a competitive
advantage from their data by
improving efficiency and...
Analytics
Training
training to individuals and
company employees(contact us
for details on pricing). Visit our
training pages to...
Recruiting
At getbismart.com, we
definitely understand just
how important analytics are
to your ongoing health and
success as an organization...