
Today’s Popular Analytical Tools : Part 1 (5 Part Series)
Working with various industries puts you in a position where you interact and get exposed to data and analytic tools. Even though businesses today are acquiring these tools, many of them never get to receive optimal gains from the investment in the tools.
There are several tools available today that are user friendly, have powerful capabilities, and provide a quick way to access data for insights. One of such tools is Tableau, which we will be talking about in this first part of our series on analytical tools
Tableau is a Business Intelligence software that allows for ease of Data Visualization – it is simply excel on steroids.
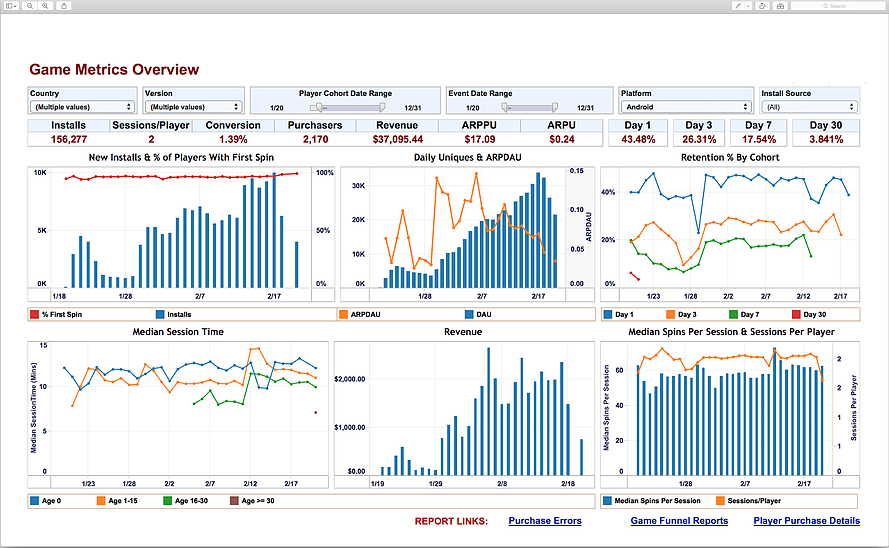
Tableau is one of the easiest platforms for connecting to data sources and creating data visualizations. One may connect to data sources such as text files, excel files, Access databases, SQL servers, clipboards, Windows Azure Marketplace, and other databases. More importantly, you can combine data from different sources into one report view. Through these sources, developers can create charts (dual axes, pie, area, line), graphs (stack, bullet, bar, histograms), scatter plots and maps (heatmaps); from which one can sort graphs, and show aggregate measures, Tableau also has the capability to calculate user – defined fields, customize and save, export and share, along with other advanced features such as creating dashboards, creating animated visualizations, creating parameters, and executing data on the fly, to name a few. Click Here for Data Analytics Training Details
Information Technology groups have come to embrace Tableau for various reasons including the direct use of data from its original source without having to move the data. This is because of the ease in the process of installation and the accessibility to various data sources and interfaces which allows for data to remain secure in its existing database.
Business and Product groups have found solace in Tableau for the very purpose of its unique visualization feature. What users love the most about it, is that you do not need the help of the engineering department to build the report. All you need is login access to the database. Tableau requires little or no coding, and there are inbuilt calculations to enable more advanced analysis. Tableau also offers statistical/mathematical function for more advanced analysis.
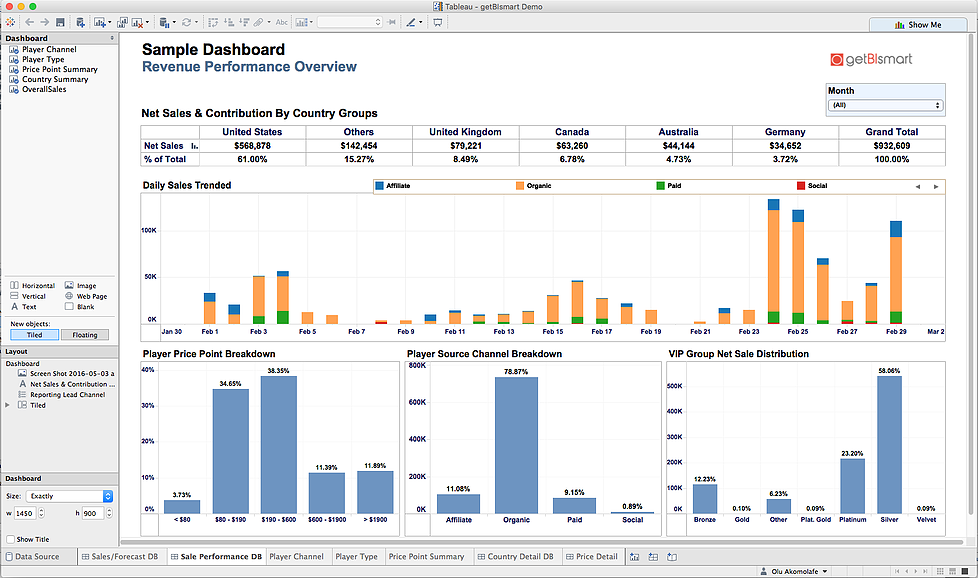
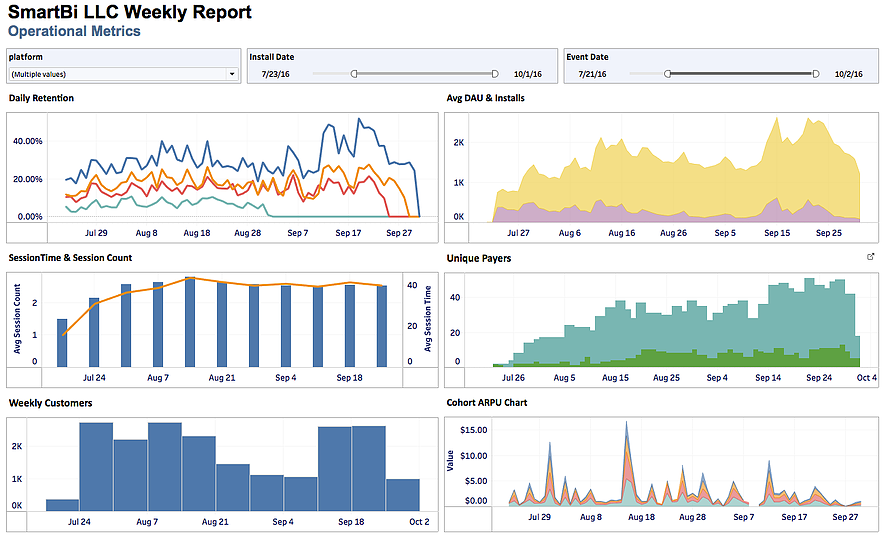
Beyond the ability to quickly put a report together, a big feature of Tableau is the ability to assemble individual reports into one report view in the form of a dashboard. With the dashboard created, users are can use any field on the report to filter all the views on the dashboard. This filtering ability makes it easy for analysts to quickly slice and dice the data for insights.
Overtime, Tableau has become a powerful tool that is useful to organizations in various industries. While there are other analytical tools to be discussed in the coming series, this Business Intelligence tool is still growing strong popularity in today’s market.

Interested in Analytics & Data Visualization, check out our new Data Analytic & Visualization Course